
If you’re a secondary economics teacher, you have probably covered the topics of supply and demand with your students. You might be looking for a fun summative project that ties these concepts together. If you are, I’ve got you covered! I had my students complete a supply and demand project where they had to create their own music festival lineup!
This is an engaging project for students and I’ll walk you through how to recreate it in your own classroom (or you can purchase the complete project here!).

Supply and Demand Project Overview
The first step is to introduce this project to students. Explain to them that they will be creating a music festival, like Coachella, and that they are in charge of organizing the headliners or main attractions for their festival. For this project, students must select 3 headliners. Students must pick musicians who they think will sell the MOST tickets, not who they personally like. To figure out which musicians are in high demand, students must research top musicians.
Some questions that can help students think about musicians who are in demand are:
- Who is currently on the Billboard top 100?
- Who has won an iHeartRadio Music Award?
- Who won the Grammy award for Album of the Year?
- Who has a lot of streams on Spotify?
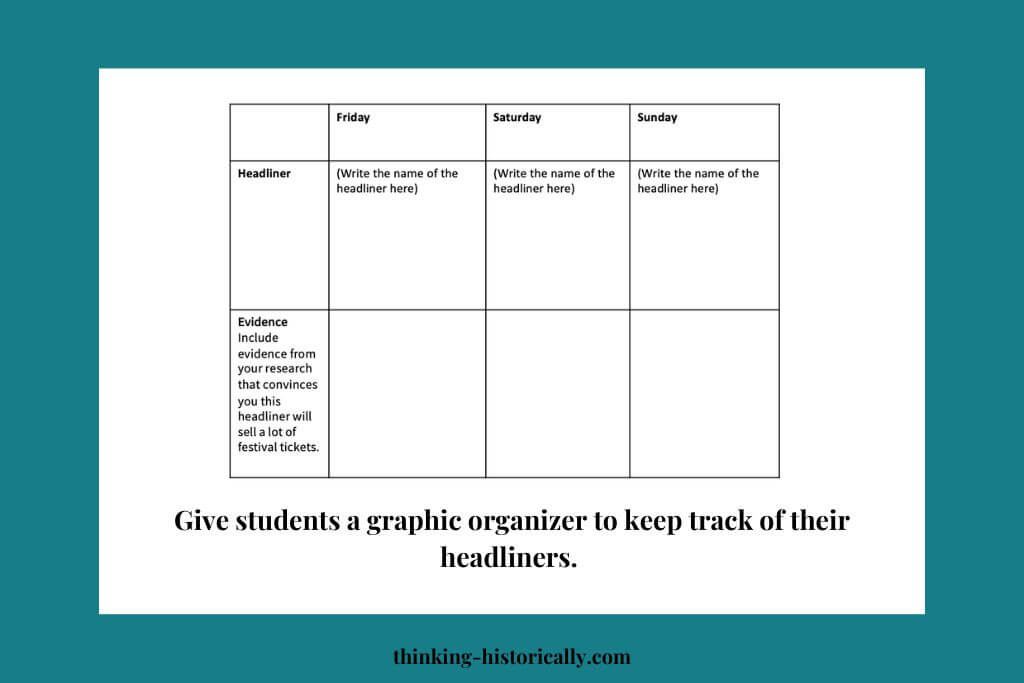
Once students have found their headliners, they must explain WHY they chose that headliner. Give students a graphic organizer, similar to the one below. They will use information from their research to justify each of their headliners.
Music Festival Poster
Once students have selected their main, the next step is for them to create music festival poster! Creating a music festival poster is easier than it sounds. For this step, students will log into canva.com (if they don’t have an account, they can sign up for free!).
After creating an account, they will click on “create a design” in the upper right side corner of the website. From there a pop down list will appear. From the drop down list they will click on “posters.” Students can browse through the poster templates to choose a template they like.
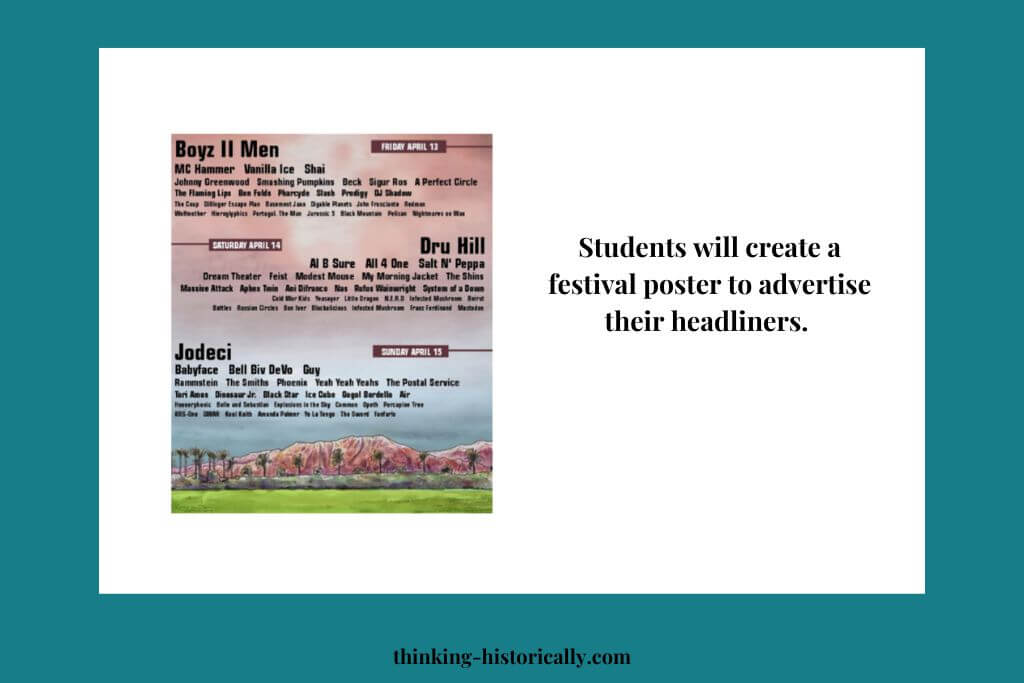
Then, students will start typing in their three main headlines. Students can type other musicians under the headliners if they like! (see example below). Students will need their posters so that they can conduct their in-class surveys!
Measuring Demand for Their Festival
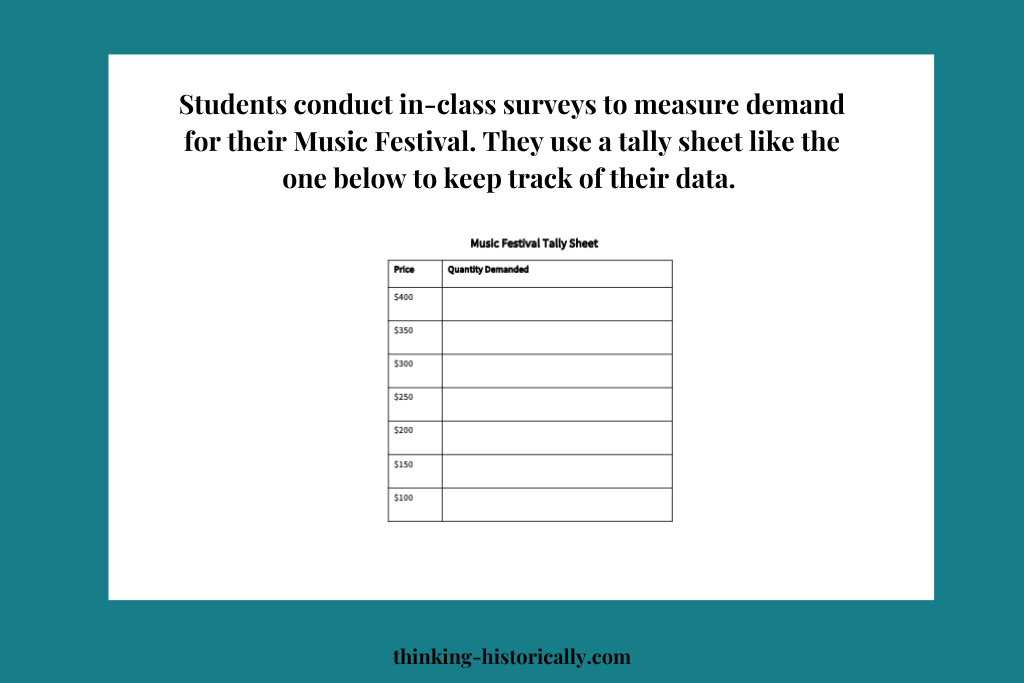
Once students complete their music festival poster, they’re ready to conduct in-class surveys! The purpose of the in-class survey is for them to figure out demand for music festival lineup. Students will use a tally sheet like the one below to keep track of their information.
For their in-class surveys students will have their festival poster ready so that they can share who will be performing at their Music Festival. They will ask their classmates the following question: How much would you be willing to spend on this Music Festival Lineup (choose ALL that apply)?
Students will put a tally mark next to each price their classmates are willing and able to purchase tickets for their music festival. Students must survey at least 15 people. You may give your students 10-15 minutes to conduct their in class survey.
Once students have completed the in class survey, they will turn the data from their tally sheet into a demand schedule.
Supply Curve and Demand Curve
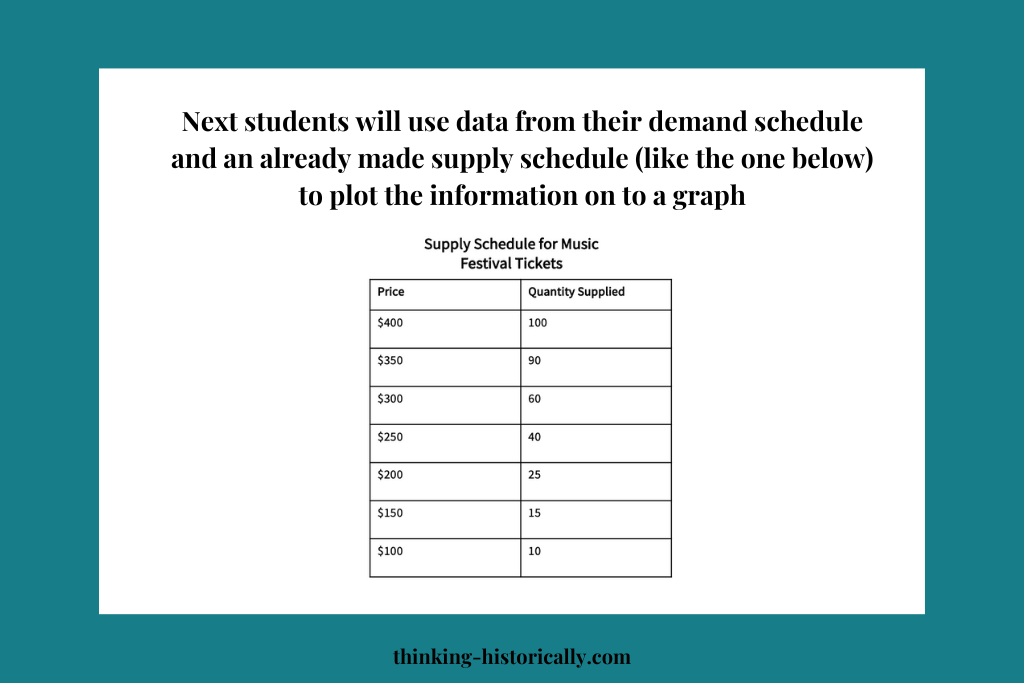
Next students will use data from their demand schedule and an already made supply schedule (like the one below) to plot the information on to a graph.
Once students have plotted the information on a supply and demand curve, they will be able to complete a report on their findings. For their report they will answer the following questions:
- Equilibrium Price
- Explain what the equilibrium price would be for your festival and how you determined the equilibrium price.
- Shortage and Surplus
- Explain why you wouldn’t charge a higher or lower price. What problems would occur if you did? Identify the prices that would lead to a shortage and surplus.
- Price Change
- Summarize two scenarios that will lead to a chance in the price of your festival ticket. One scenario must show an increase in price. The second scenario will cause a decrease in price (Hint: think about the determinants of demand).
This project is a great way to get students up and moving and thinking about supply and demand without even knowing it!
You can recreate this project in your class or purchase the complete project here. The complete project includes rubrics, a suggested teaching guide, and graphic organizers.
Happy teaching!


One Response