Are you new to teaching economics to high school seniors this year? Are you looking through the state standards wondering where to even start? As you look through the standards, are you thinking, “What are the law of supply and law of demand?” “How do you even teach this stuff?” “Where can I find some law of supply and law of demand lesson plans?” I totally get you and know how you feel! But don’t worry, I’ve got you covered!
When I started teaching economics, I would look at the state standards trying to make sense of it all. Teaching economics was a challenge and I had no idea what the terms and concepts meant. Fortunately, my then partner (now husband) studied economics and was able to help me out. Through the years, I have been able to create activities for my economics class.
If you’re feeling stuck on how to teach economics, a great place to start is through teaching students about the laws of supply and demand. Supply and demand sounds difficult to teach. However, when they are broken down they are simple concepts that students use in their everyday life. A bonus is that these concepts can be a lot of fun to teach too! I’ll walk you through some supply and demand activities I’ve used in my classroom. Before we get into activities for supply and demand, let’s break these concepts up and talk about demand!
What is demand?
So what is demand? Demand is the various amounts of a certain product that a person is willing AND able to buy at various prices given a point in time. A great way to get students to understand this concept is by giving them an example of demand. What better way to get students to understand demand but through an example using ice cream! To open up a discussion about demand, ask your students the following questions, “How many people do you think would be willing and able to buy a scoop of ice cream if it only cost $1.00? What if the price was increased to $9.00 a scoop? What would you do in this situation?”

When teaching about demand, it is important that students understand that demand and quantity demanded are related but DIFFERENT concepts. Quantity demanded is more specific. Quantity demanded refers to how much of a product a person is willing and able to buy at a certain price. If we go back to the ice cream example, we can explain that less people would be willing and able to buy a scoop of ice cream at $9.00 than at $1.00 a scoop. For instance, the quantity demanded or amount of ice cream sold at $9.00 might be 5 whereas the quantity demanded of ice cream sold at $1.00 might be 20.
Notice that as the price increases, the amount of product sold decreases but as price decreases, the amount of a product sold increases. This is the law of demand. In other words, the more expensive in price a product is, the less that people are willing and able to buy it and the cheaper in price a product is, the more people are willing and able people to buy it.
An interactive law of demand activity!
Now that we’ve got the definition of demand out of the way, let’s get down to the fun stuff. A law of demand activity that I’ve used in my classroom that demonstrates how demand works is to have students conduct surveys to identify the demand for popular musicians. The musicians I used were Ariana Grande, Post Malone, Marky Mark and Funky Bunch, and Rick Astley (but feel free to change these musicians to fit your students’ interest!).
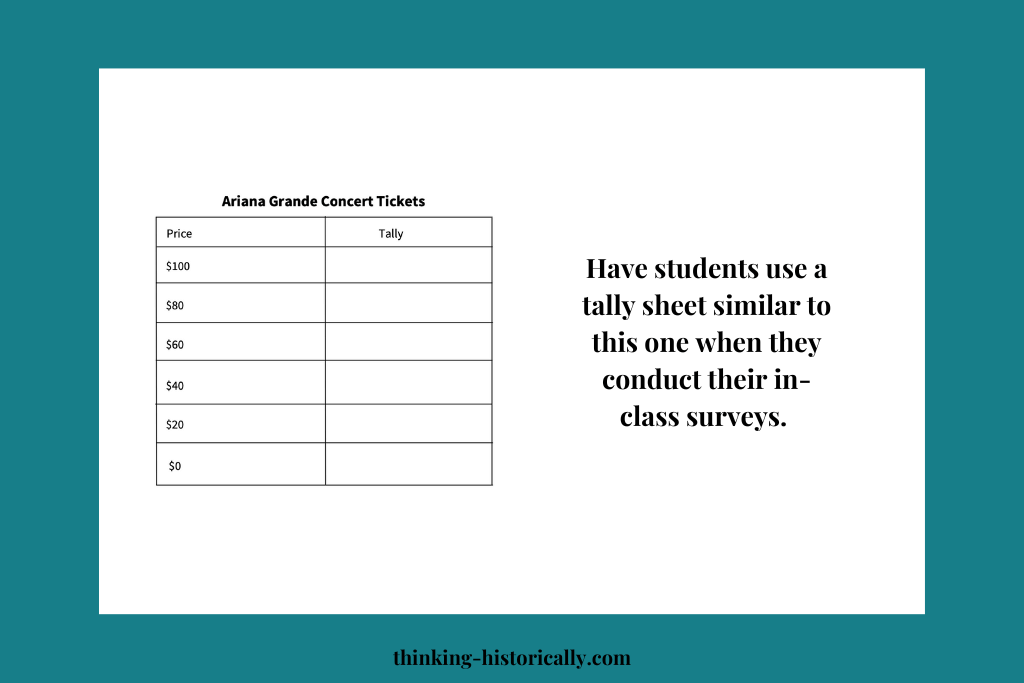
To set up the survey, create tally sheets for each musician. The tally sheet should have the musician’s name at the top and a list of prices from the highest price to the lowest price. You may use a tally sheet similar to the one below. Then give students about 10-15 minutes to go around the room to ask their classmates, “At which prices would you be willing and able to purchase a concert ticket for each of the following musicians?” Students will place a tally mark next to each price that their classmates are willing and able to buy a ticket.
To produce buy-in, play the musicians music in the background while students conduct their surveys. After students conduct their survey, they will turn their tally sheet into a demand schedule and curve. From their surveys, students will determine which musicians were in high demand and which musicians were in low demand.

What is supply?
Now that we’ve talked about demand, let’s talk about supply! So what is supply? Supply is the goods or services that a producer or business makes and offers at different possible prices. The definition of the law of supply is that at higher prices, producers will offer and make more goods or services than at lower prices. The law of supply and demand in economics are opposite of each other. A great question to ask students is, “Why do you think producers want to sell more at higher prices?” You can also explain to students that quantity supplied is the amount of a product that a producer offers their product or service at a specific price.
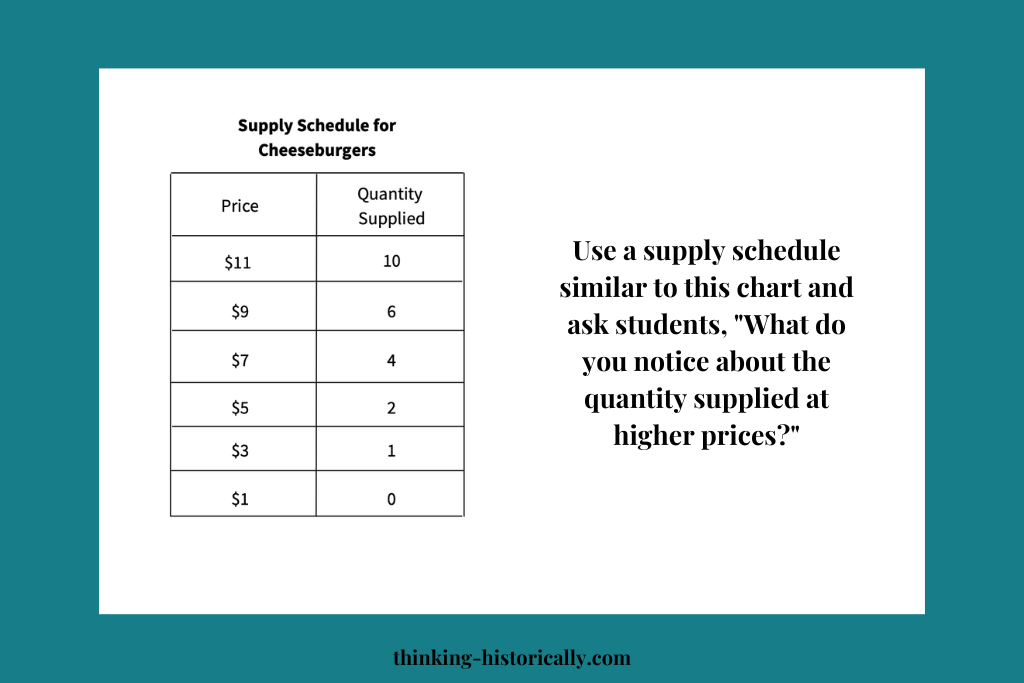
A quick law of supply activity that can help students understand the concept of supply is to show them a supply schedule (or chart) that shows all the possible prices that a producer would offer their goods or services. You can use the supply schedule of cheeseburgers below! Show students the supply schedule and ask, “What do you notice about the quantity supplied at higher prices? Why do you think producers offer more at higher prices?”

You might still be wondering, but “how do the laws of supply and demand work together and how can I get my students to understand this?” Don’t worry, I’ll go over this next!
A law of supply AND demand activity!
A fun activity that shows how the law of demand and supply intersect is to have students create their own Music Festival Lineup! To start, have your students decide who will be headliners (or main attractions) for the Music Festival. It is important to remind students that they must choose headliners in high demand. We want our consumers to be willing and able to buy our Festival tickets! To do this, students will have to research things likes which artists are on the Billboard Top 100 list. Once students have created their Music Lineup, students will measure the demand for their music festival.

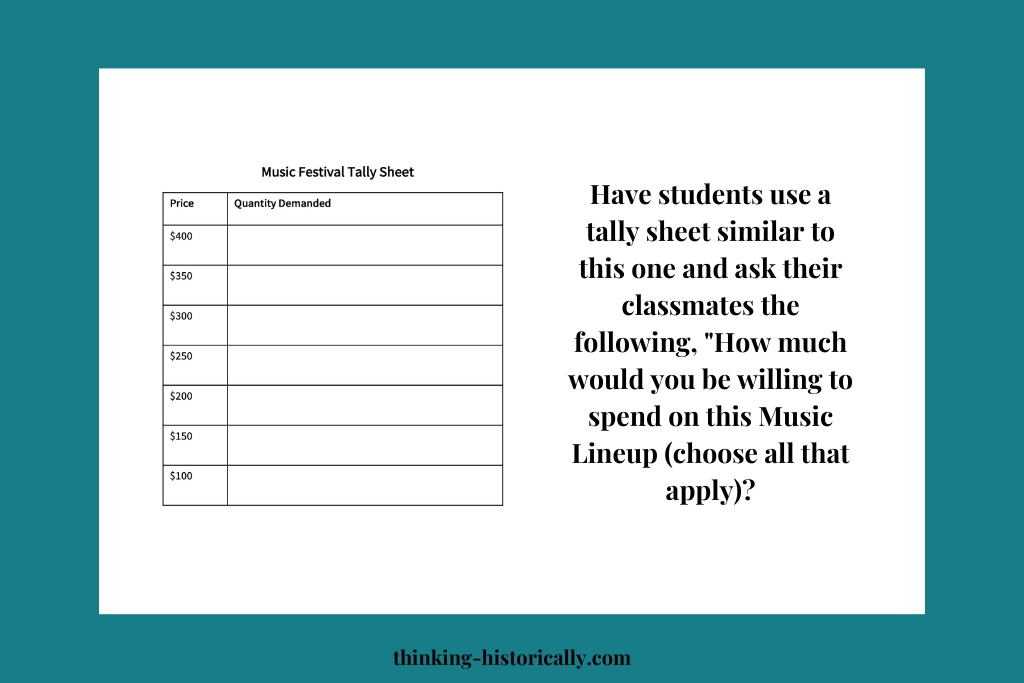
To do this, give students the tally sheet like the one below. With the tally sheet , “How much would you be willing to spend on this Music Lineup (choose all that apply)?”
Students will place a tally mark next to each price their classmates identify. From their survey, students will be able to identify which musicians are in demand. They will then turn their tally sheet into a demand schedule.

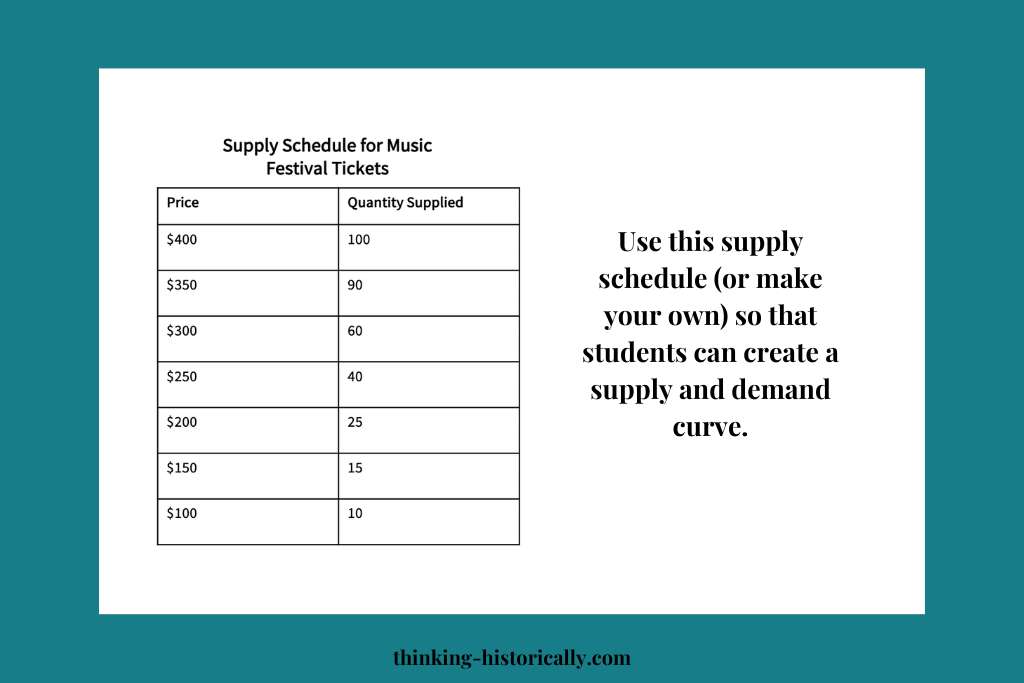
Next, give your students a supply schedule. You may use the supply schedule below or make your. Students will then use the supply schedule you give them and the demand schedule they created. With the supply schedule and demand schedule they will plot their information onto the same graph.
After plotting the information onto the same graph, they will be able to identify the equilibrium price! Equilibrium price is important because it is the point at which supply and demand are equal!

If you don’t want to create this project on your own, feel free to check out my store for this project and other economics resources!


